In this post I show you: a) How to retrieve data from OECD database using OECD R-package, b) how to run k-means clustering in R using the base package, and c) how to visualize data with the ggplot2 R-package.
I will run a k-means clustering algorithm over a dataset retrieved from the OECD database, using the base and OECD packages in R.
First, I retrieve some OECD gdp data:
# import OECD package in R
library(OECD)

# retrieve economic gdp data measured with output methode - for all countries, between 2008 and 2019 ; for a country selection
# countries included:
# -- austria
# -- belgium
# -- finland
# -- germany
# -- italy

data_df <- as.data.frame(get_dataset(dataset = "SNA_TABLE1",
                                     filter = list(c("AUT","BEL","FIN","DEU","ITA")),
                                     start_time = 2017,
                                     end_time = 2018))

# show the header of that dataset
head(data_df)
## LOCATION TRANSACT MEASURE TIME_FORMAT UNIT POWERCODE REFERENCEPERIOD obsTime
## 1 AUT B1_GA C P1Y EUR 6 <NA> 2017
## 2 AUT B1_GA C P1Y EUR 6 <NA> 2018
## 3 AUT B1G_P119 C P1Y EUR 6 <NA> 2017
## 4 AUT B1G_P119 C P1Y EUR 6 <NA> 2018
## 5 AUT P3_P5 C P1Y EUR 6 <NA> 2017
## 6 AUT P3_P5 C P1Y EUR 6 <NA> 2018
## obsValue OBS_STATUS
## 1 370295.8 <NA>
## 2 385711.9 <NA>
## 3 330332.9 <NA>
## 4 344658.8 <NA>
## 5 357239.7 <NA>
## 6 371036.2 <NA>Processing the retrieved OECD dataset
In a next step I filter further, using dplyr:
# importing dplyr
library(dplyr)
library(magrittr)
# apply filter function from dplyr package
data_df <- data_df %>% filter(TRANSACT == "B1_GA",
MEASURE == "C",
TIME_FORMAT == "P1Y",
POWERCODE == "6")
# using base R functionality to ensure subsetting of dataset without any estimates or "ball-park-figures"
data_df <- data_df[is.na(data_df$OBS_STATUS),]
# select columns relevant for further analysis
data_df <- data_df %>% select(LOCATION, obsTime, obsValue)
# sub-set into two different dataframes
data2017_df <- subset(data_df,obsTime == "2017")
data2018_df <- subset(data_df,obsTime == "2018")
# merge into one new data frame
joint_df <- inner_join(data2017_df,data2018_df,by="LOCATION") %>% select(LOCATION,obsValue.x,obsValue.y)
colnames(joint_df) <- c("country","val2017","val2018")
# view header of data subset
head(joint_df)## country val2017 val2018
## 1 AUT 370295.8 385711.9
## 2 BEL 446364.9 459819.8
## 3 FIN 225785.0 234453.0
## 4 DEU 3244990.0 3344370.0
## 5 ITA 1736601.8 1765421.4Apply k-means clustering algorithm from R base package
Now I run a k-means clustering algorithm on this small dataset, using the base package in R. I will search for two cluster (middel) points, i.e. two centers:
# create cluster analysis object
clustering_obj <- kmeans(joint_df[,c(2,3)],centers=2)

# assign cluster to joint_df
joint_df$cluster <- clustering_obj$cluster
Visualize results using the ggplot2 package in R
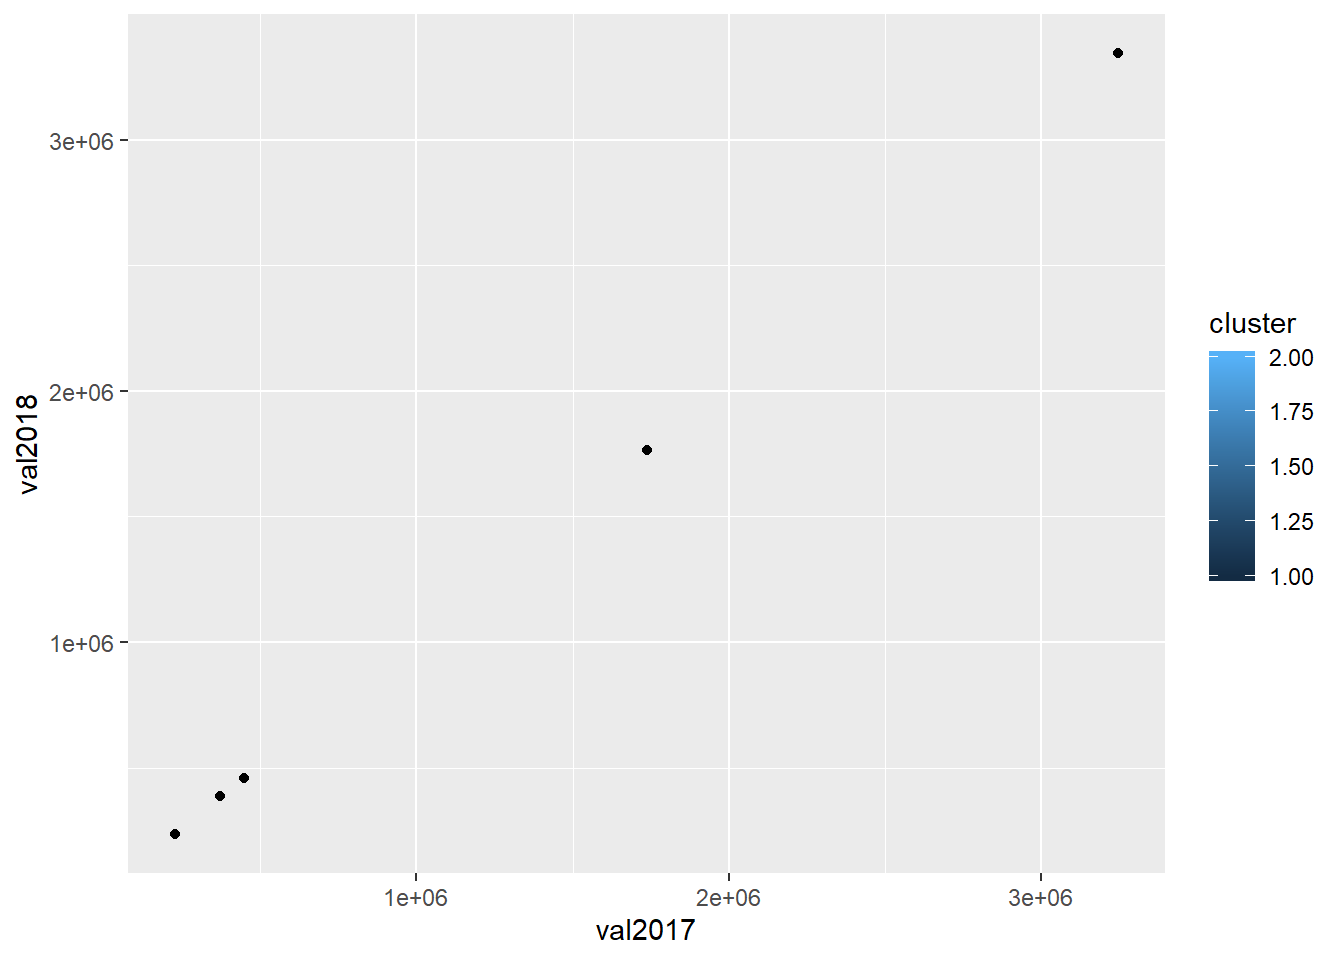
Using a colored scatterplot we can visualize cluster assignment in this small dataset:
# import ggplot2 library
library(ggplot2)

# create scatterplot grouped by cluster index, using discrete color scale
ggplot(joint_df) + geom_point(mapping = aes(x = val2017, y = val2018, fill = cluster))
If you want to learn more about the OECD R-package go ahead and check out my posts on how to retrieve e.g. inland freight OECD data in R.

Data scientist focusing on simulation, optimization and modeling in R, SQL, VBA and Python


Leave a Reply